Mapping the World’s Infrastructure Gap
The World Bank released its latest report, “Infrastructure Foundations: From Current Assets to Future Growth,” which presents the most exhaustive global database on physical infrastructure assets, according to its authors. The dataset covers around 200 countries and records energy generation and transmission facilities, as well as the road and rail networks in addition to digital infrastructure, including data centers, cell towers, fiber optic, and submarine cables. Most assets are geolocated down to the municipal level, which allows for precise spatial analysis, and many datasets date back as long as the last ten years.
The case study begins with a grim prognosis explaining what it calls the “infrastructure return imperative.” About 685 million people, mostly based in Sub-Saharan Africa, are without electric supply; a billion people live at a distance of not less than 2 km away from an all-season road; only about half of the urban population in the world enjoys an adequate public transport system; and 2.6 billion people remain offline. Nevertheless, the report indicates that infrastructure development does not mean automatically that development programs are efficient and are targeted properly.
Comparing visually populations of Brazil and Nigeria makes it obvious how far apart both countries are. Brazil has developed a wide network of electricity supply, whereas in the case of Nigeria, the south has almost everything done, while the north is left badly underestimated. The total output levels of Brazil exceed that of Nigeria roughly fourteen times.
How Infrastructure Evolves with Wealth
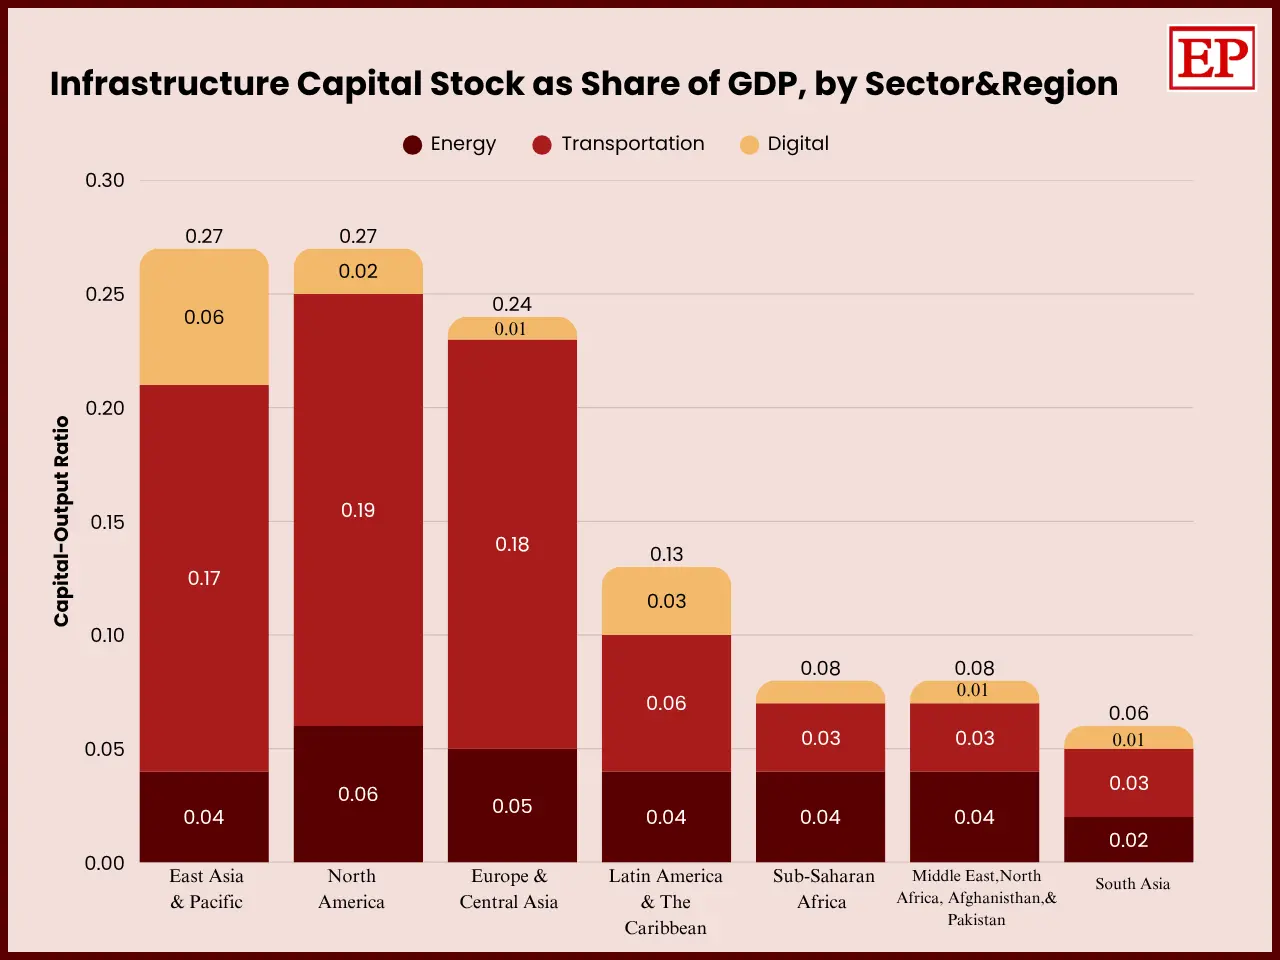
Looking at infrastructure per capita, researchers see a very nice relationship between wealthier countries having more infrastructure, more kilometers of roads, more energy capacity, and more cell towers for every citizen. An interesting picture appears when the capital stock is compared with GDP instead of population figures. While energy capital and digital capital create a stable or slightly decreasing share of GDP as income increases, transportation capital stock keeps growing. In developed countries, transportation takes roughly 75% of capital investments, with only approximately 25% for the poorest countries. When looking regionally, it is worth noting some divergences: East Asia and the Pacific, along with Europe and Central Asia, are characterized by having more infrastructure capital than should be expected according to income levels. In contrast, Latin America, Sub-Saharan Africa, South Asia, and the region of the Middle East/North Africa are relatively poor in infrastructure capital. The meta-analysis of previous studies shows that transportation investments are the most profitable in developing countries with significant gaps in transportation infrastructure; energy returns are the same across all income levels, while investments into telecommunications are the most effective in developed countries where people are already connected.
Efficiency Ratios and Investment Priorities
The primary analytic mechanism employed in the report is the “infrastructure efficiency ratio,” which determines a project’s social rate of return in comparison to its financing cost. A ratio greater than 1 indicates attractive investment opportunities, while a ratio less than 1 indicates overbuilding or unbeneficial pricing. The interesting fact is that it turns out that 92% of countries have efficiency ratios greater than 1 for transport and 98% for energy, which points to great potential for investment in this field, especially in Sub-Saharan Africa. As for Nigeria’s efficiency ratios, they are equal to 18 for energy and 32 for transport, indicating an acute lack of investment. Brazil shows lower efficiency figures (2.4 for energy and 6.4 for transport) that indicate the possibility of making specific improvements rather than large investments.
According to the research, the best option when investing in infrastructure is to choose investments across multiple sectors, as their combination provides the highest effect, such as roads that enhance the productivity of factories that require energy. The model, which assumes 10% of GDP to be allocated to the sectors of energy and transportation, shows that the situation is different in each region: some countries in Sub-Saharan Africa would benefit from the focus of investment on transportation, while Europe and Asia would prefer investing in energy. As for the future plans, the researchers want to include data on ports, airports, and water/sanitation infrastructure and create an interactive online tool that will allow them to stimulate optimal investment in various cases.