LATEST

Explained

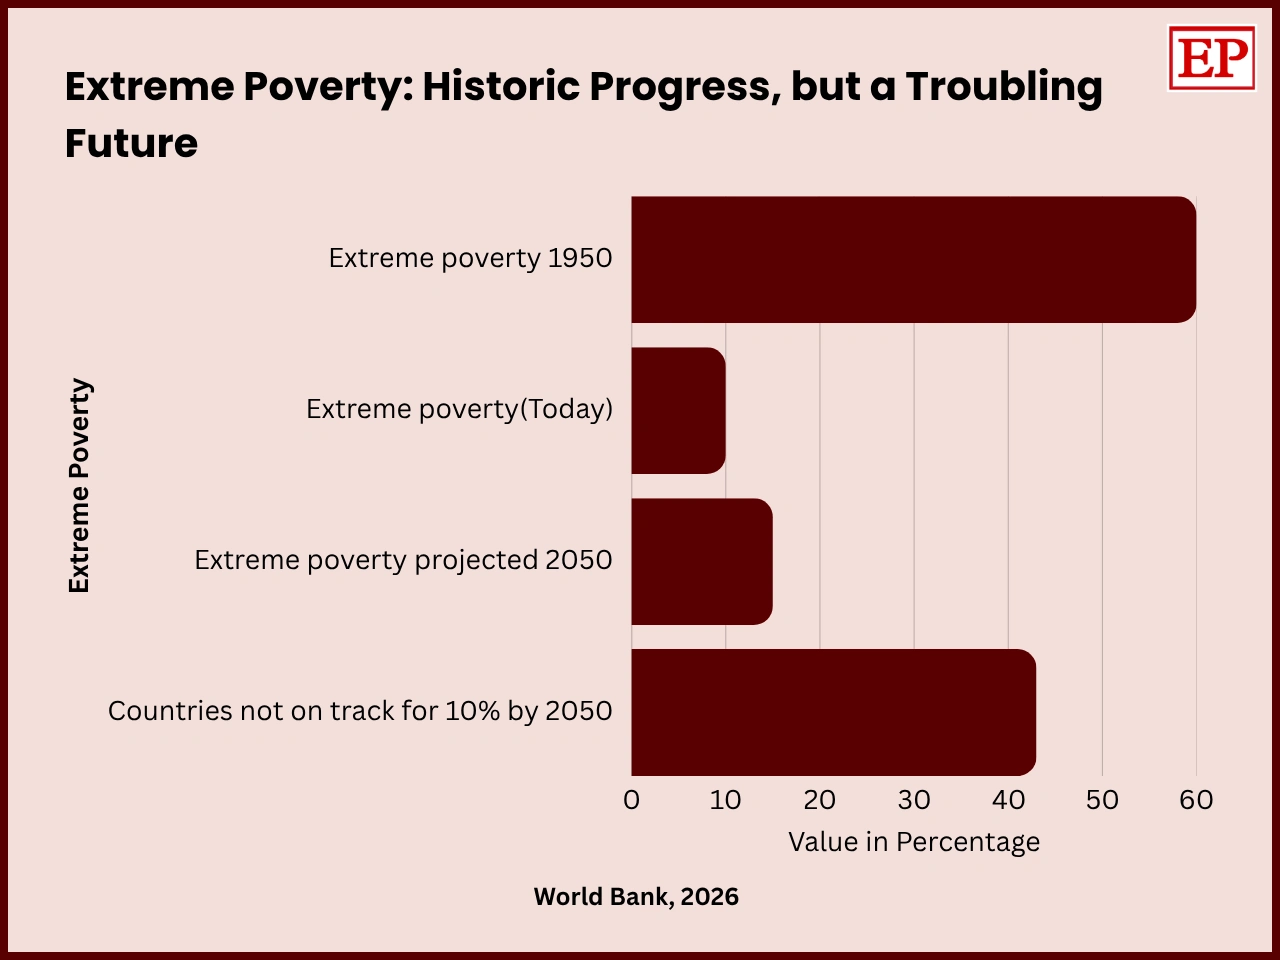
Horizontal bar chart titled Extreme Poverty: Historic Progress but a Troubling Future shows extreme poverty was 60% in 1950, dropped to 10% today, projected to rise to 15% in 2050, with 42% countries not on track for 10% poverty reduction by 2050, source World Bank 2026
Explained ·Sep 13, 2026

Extreme Poverty Falls to 10% But Risks Rising to 15% by 2050

The world has achieved a historic reduction in extreme poverty, but progress is becoming increasingly uneven. With poverty rising in many countries and the global rate potentially reaching 15% by 2050, decades of development gains face a serious risk of reversal.

Bar chart showing estimated long-term EU GDP gains from financial-market reforms: about 2% from cross-border banking reforms and nearly 3% from broader financial reforms, based on IMF estimates.
Explained ·Sep 11, 2026

Europe Has the Savings. Why Isn’t Enough Capital Reaching Its Innovators?

Europe has abundant savings, but fragmented financial markets prevent capital from reaching high-potential businesses and innovative startups. An IMF analysis suggests that deeper integration of banking, venture capital, pension funds and insurance markets could raise EU GDP by around 2% from banking reforms alone and potentially close to 3% with broader financial reforms.

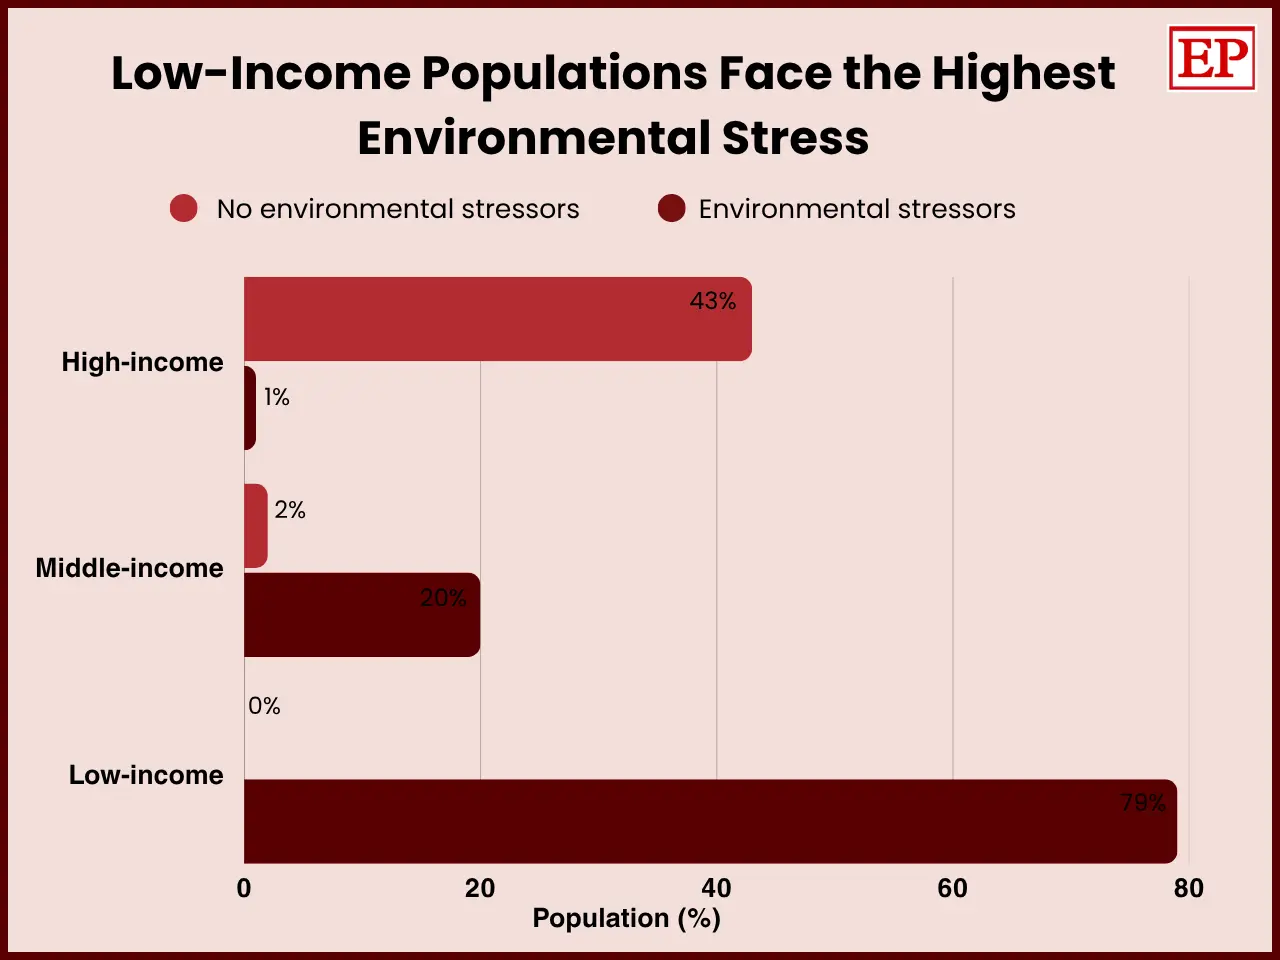
Horizontal bar chart comparing environmental stress exposure by income group. It shows 79% of people in low-income countries facing all three stressors—degraded land, unsafe air and water stress—compared with 20% in middle-income and 1% in high-income countries.
Explained ·Sep 6, 2026

90% of the World Faces Environmental Stress as Nature Emerges as an Economic Issue

Environmental pressures are, in effect, economic pressures that are now affecting jobs, food, health, livelihoods, productivity and development. Given that more than 90% of the world's people now live in a region with at least one "stressor", conservation is likely crucial for ensuring continued economic prosperity.

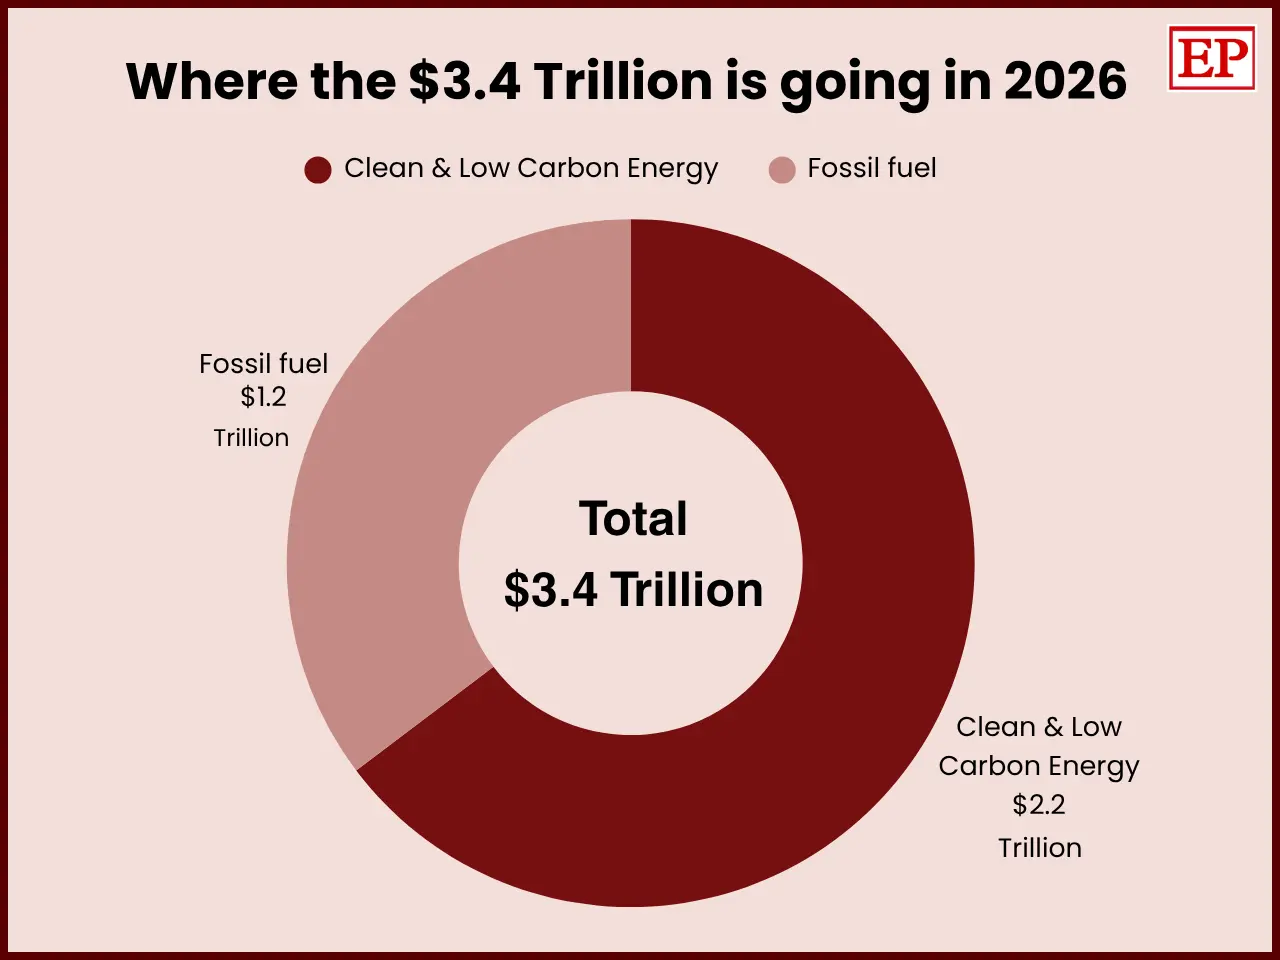
Donut chart showing where the $3.4 trillion global energy investment in 2026 is expected to go: $2.2 trillion (about 65%) toward clean and low-carbon energy and $1.2 trillion (about 35%) toward fossil fuels. The chart highlights the shift toward cleaner energy investment. Donut chart showing where t
Explained ·Sep 4, 2026

$3.4 Trillion Energy Bet in 2026: $2.2T Clean vs $1.2T Oil & Gas Despite War

What is interesting is that it was noted that most of this year’s investments have already been put into the energy projects long before the outbreak of the crisis, which means that the implications of the conflict in the Middle East will become evident in investment patterns over a few years rather than immediately.

Horizontal bar chart titled Extreme Poverty: Historic Progress but a Troubling Future shows extreme poverty was 60% in 1950, dropped to 10% today, projected to rise to 15% in 2050, with 42% countries not on track for 10% poverty reduction by 2050, source World Bank 2026
Explained ·Sep 13, 2026

Extreme Poverty Falls to 10% But Risks Rising to 15% by 2050

The world has achieved a historic reduction in extreme poverty, but progress is becoming increasingly uneven. With poverty rising in many countries and the global rate potentially reaching 15% by 2050, decades of development gains face a serious risk of reversal.

Bar chart showing estimated long-term EU GDP gains from financial-market reforms: about 2% from cross-border banking reforms and nearly 3% from broader financial reforms, based on IMF estimates.
Explained ·Sep 11, 2026

Europe Has the Savings. Why Isn’t Enough Capital Reaching Its Innovators?

Europe has abundant savings, but fragmented financial markets prevent capital from reaching high-potential businesses and innovative startups. An IMF analysis suggests that deeper integration of banking, venture capital, pension funds and insurance markets could raise EU GDP by around 2% from banking reforms alone and potentially close to 3% with broader financial reforms.

Horizontal bar chart comparing environmental stress exposure by income group. It shows 79% of people in low-income countries facing all three stressors—degraded land, unsafe air and water stress—compared with 20% in middle-income and 1% in high-income countries.
Explained ·Sep 6, 2026

90% of the World Faces Environmental Stress as Nature Emerges as an Economic Issue

Environmental pressures are, in effect, economic pressures that are now affecting jobs, food, health, livelihoods, productivity and development. Given that more than 90% of the world's people now live in a region with at least one "stressor", conservation is likely crucial for ensuring continued economic prosperity.

Donut chart showing where the $3.4 trillion global energy investment in 2026 is expected to go: $2.2 trillion (about 65%) toward clean and low-carbon energy and $1.2 trillion (about 35%) toward fossil fuels. The chart highlights the shift toward cleaner energy investment. Donut chart showing where t
Explained ·Sep 4, 2026

$3.4 Trillion Energy Bet in 2026: $2.2T Clean vs $1.2T Oil & Gas Despite War

What is interesting is that it was noted that most of this year’s investments have already been put into the energy projects long before the outbreak of the crisis, which means that the implications of the conflict in the Middle East will become evident in investment patterns over a few years rather than immediately.