LATEST

World News

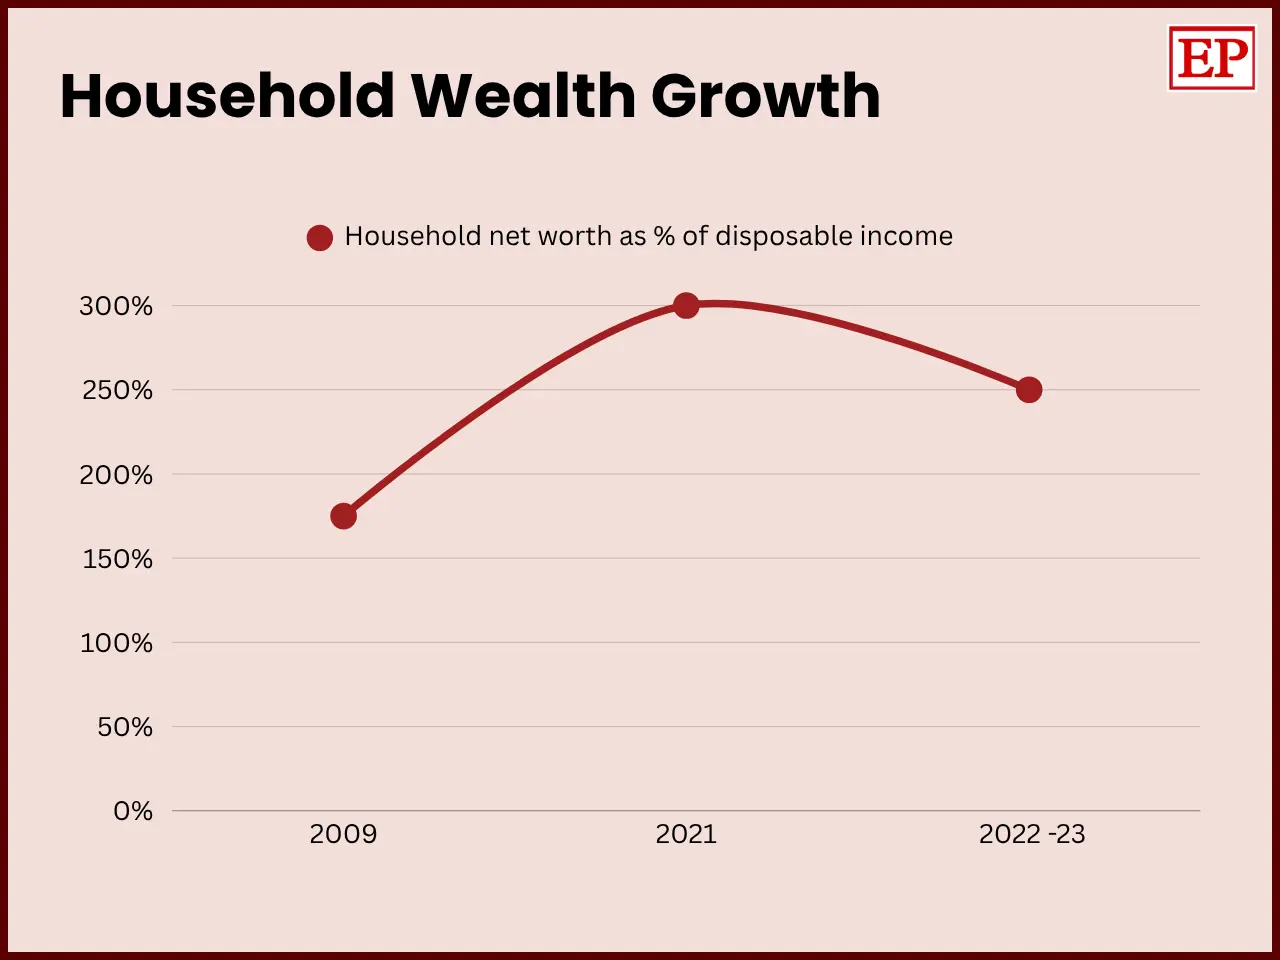
Line chart titled “Household Wealth Growth” showing household net worth as a percentage of disposable income. The value rises from 175% in 2009 to a peak of 300% in 2021, then declines to 250% in 2022–23. The chart uses a red line with circular data points on a light pink background. The x-axis show
World News / Aug 21, 2026

Top 1% Now Own More Than Bottom 40% Combined

The OECD’s net worth as a percentage of disposable income has risen from 175% in 2009 to 300% in 2021. Top 1% own more than bottom 40% combined. Concentration diminished in late 2010s as housing prices rose, making it easier for middle/low-income homeowners to buy homes.

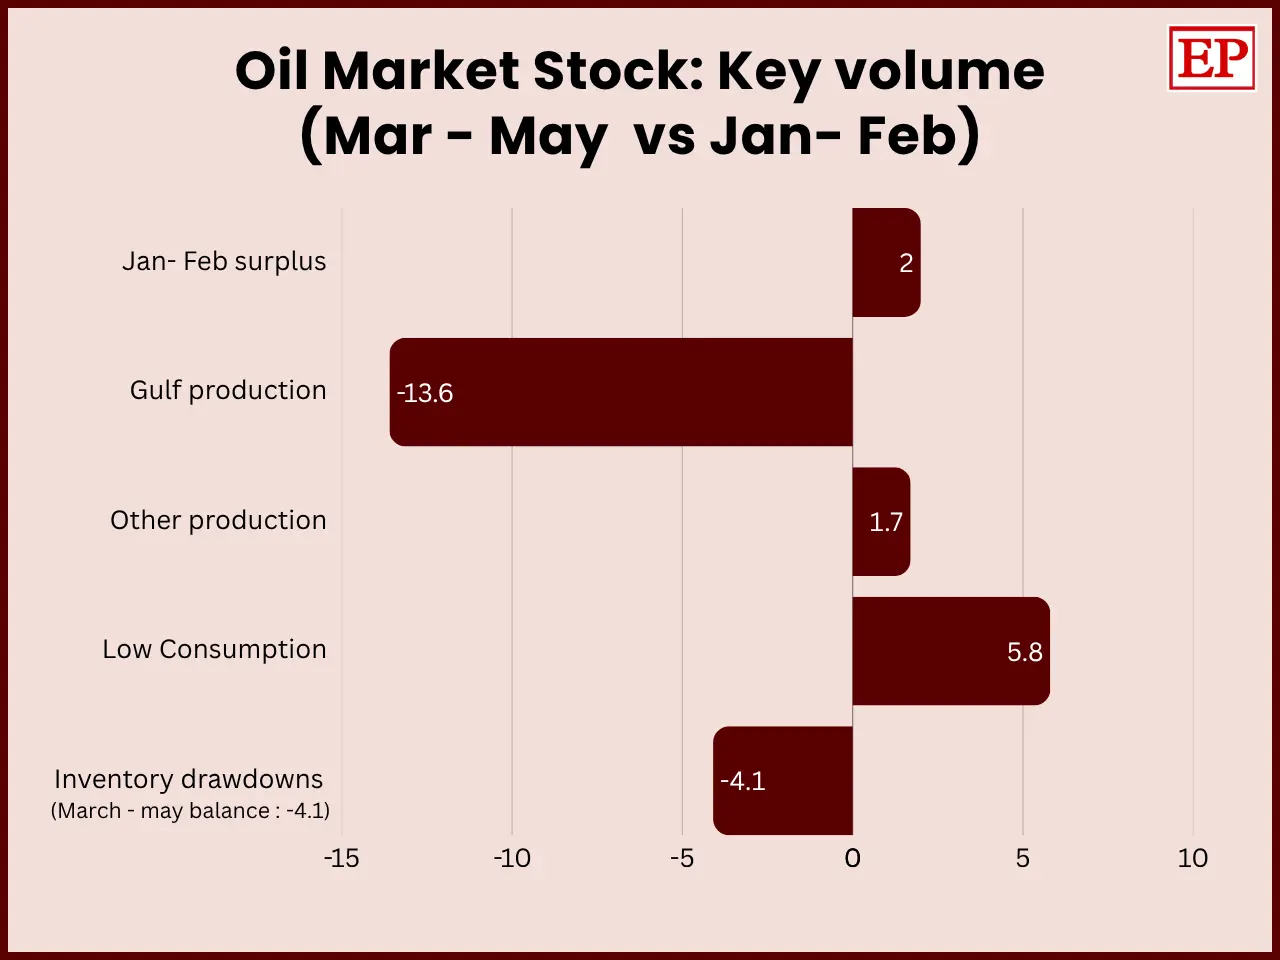
Horizontal diverging bar chart titled “Oil Market Stock: Key volume (Mar–May vs Jan–Feb)”. It compares changes in oil-market volumes, with bars extending left for negative values and right for positive values. Gulf production shows the largest decline at −13.6, followed by inventory drawdowns at −4.
World News / Aug 17, 2026

Strait of Hormuz Blocked, 20% Oil Gone- Prices Still Held at $90-$100

The war in the Middle East has disrupted the oil market on an unprecedented scale, practically blocking the Strait of Hormuz and stopping around 20 percent of the global flow of crude oil. However, prices increased only to the range of $90-100 per barrel instead of skyrocketing due to three factors.