For more than 100 years, economists and futurists have been forecasting that as societies grow more prosperous and technology advances, the amount of work people do will noticeably decline. By the early 21st century, John Maynard Keynes predicted a 15-hour workday. In this era, AI enthusiasts hold these same hopes. But the new study by Amory Gethin and Emmanuel Saez, based on a massive database covering the world, brings this widely held notion into question.
Their main conclusion is surprising: There is no evidence that longer working hours are associated with higher levels of economic prosperity for prime-age workers. The researchers state, however, that the determinants of work effort are not economic development, but collective social and political decisions made in regard to education, retirement, labor law, and income support.
This has been the largest-scale set of data ever collected for this type of study. It relies on data from household surveys collected by the International Labour Organization, the World Bank, and many national data sources and includes 160 countries (97 percent of the world’s population), with time series available for 86 countries over the past 20 years. The researchers calculated the hours spent on all the economically productive tasks, such as work in agriculture, but not domestic work like cooking and taking care of children, for each week. 59 percent of adults aged 15 years and over in the world are employed and work an average of 43 hours per week. With non-working adults added, the global number goes down to approximately 25 hours a week. The hours have a very distinct life cycle progression, increasing steeply in early adulthood, reaching their peak in prime working ages and declining significantly after 60 years. Gender differences are significant: men work about two-thirds of the total working hours in the world, while women work about one-third, a difference that is due to the lower participation rate of women in the labor market rather than to differences in working hours of those who are already engaged in the labor market.
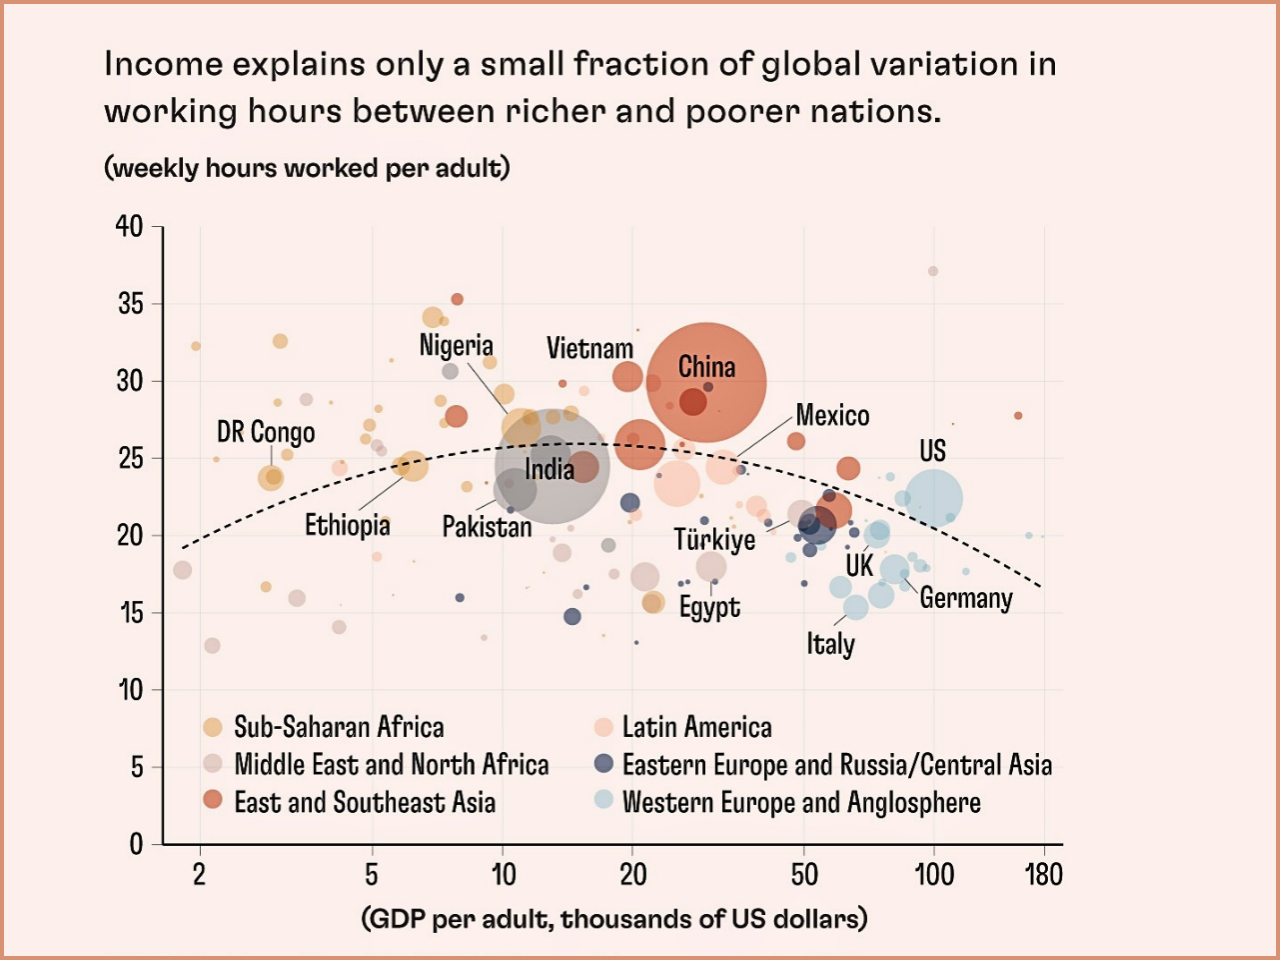
There is a complex relationship between national income and working hours. Across income levels, hours spent per adult worker are lowest in the poorest and highest in the middle-income countries and have a mild bell-shaped distribution. However, only a part of the variation across countries can be explained by their income levels. There can be a huge disparity between the working patterns in countries with similar levels of income. Other countries, such as France, South Africa, and Afghanistan, have lower hours, as do Madagascar, Vietnam, and China, although these are in vastly different places on the development spectrum.
Structural economic transformation is needed here. The more rapidly industrializing middle-class economies tend to create a high demand for labor and long hours. In contrast, more developed countries have more developed labor laws and more formalized employment contracts, which help balance working time.
Policies have a greater influence on work patterns than market forces and individual wealth. A lower proportion of young and old people working can be attributed to the growing numbers of people in school and public pension programs. For prime-age adults, total hours have seen only slight fluctuations since 1900, but there has been a significant gender shift with men’s hours of work declining and women’s rising, largely offsetting each other. The effect of labor taxes on hours is small when workplace regulations are taken into account. Finally, the distribution of work and leisure is a function of institutions, laws, and social norms and hence has a degree of policy leverage beyond that provided by the labor market.