The latest edition of the World Bank Group scorecard is a very informative representation of the current state of global development, as it indicates that the world is becoming not only more developed but also meeting the same structural problems. Below the aggregate numbers are uneven regional patterns, increased vulnerability, and great increases in human capital. It is clear in a closer look at the figures and visuals that, despite impressive improvement in service and financial accessibility, poverty and displacement are the two sticks in the bones of inclusive growth.
In extreme poverty, around 839 million people, or 10.3 percent of the global population, remain in poverty. Based on the long-run poverty trend chart (2000-2024), poverty rates in all countries of the world have decreased steadily over the past 20 years, which allows us to conclude about the overall effects of economic growth in developing countries, social safety nets, human capital, and investment. Despite this fact, in recent years the curve seems to have flattened, and this indicates slower progress in reducing poverty.The load is highly concentrated on a regional basis. The global poverty profile is the most unevenly distributed, with Sub-Saharan Africa having nearly 46 percent of the population living in extreme poverty in 2024. This degree of concentration is reflected in the regional comparison, where the trend of Africa is sharply different from the rest of the world. Structural issues such as weak states, climate shocks, population pressures, and the lack of industrial transformation remain barriers to rapid poverty reduction.The region of the Middle East and North Africa has the second-highest level of poverty, with an incidence of about one out of every eight individuals.
Although the world as a whole is no longer developing backward as it was in 2000, it appears that the geography of poverty is becoming increasingly agglomerated, meaning that in the future, the reduction of poverty will not be so dependent on general global growth but rather on specific regional actions.Electricity Access: Massive Gains, Including Continuous Gaps. The electricity access visual presents a more optimistic narrative, albeit with caveats. In 2000, a quarter of the population in IDA- and IBRD-eligible countries lacked access to electricity. By 2023, this share fell below 10%. The chart shows a downward trend, indicating that one of the most successful transitions was made in the last twenty years. One of the most notable success stories is South Asia, which is now on its way to near-total electrification. The trend chart indicates that policy reform and grid expansion, as well as off-grid renewable solutions, are coordinated and have been decisive. Countries such as India and Bangladesh have undergone electrification, particularly in education, and reforms in small enterprise productivity and household well-being.
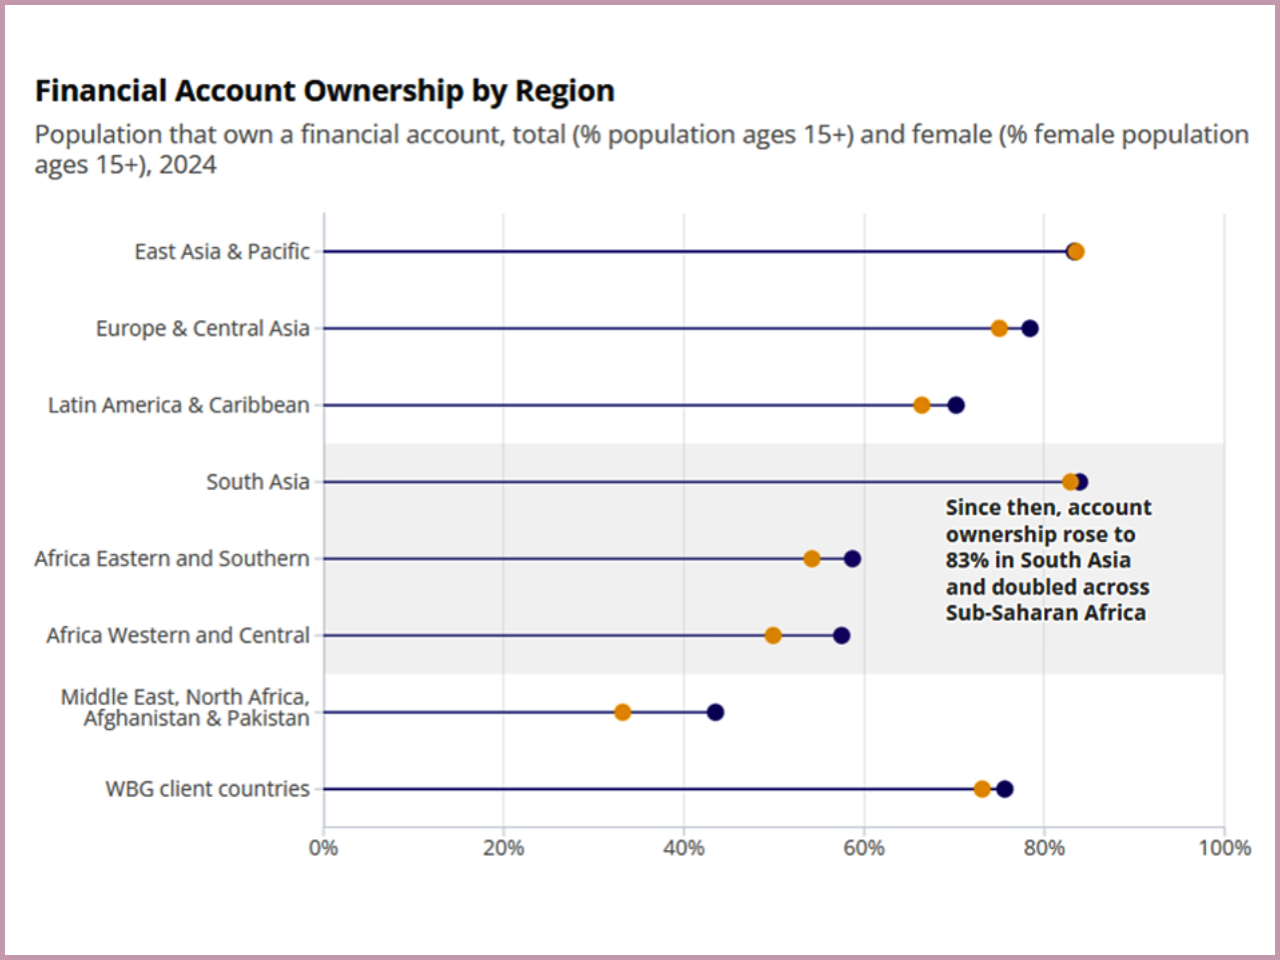
However, the region suffers from an imbalance when compared. Sub-Saharan Africa is the apparent exception, and its access rates are much lower than in the rest of the globe. The distance between Africa and the other parts of the chart is long-standing and very wide, which highlights the infrastructural deficiency and lack of funds. It is under this knowledge that the Mission 300 project aims to deliver electricity to 300 million people in Sub-Saharan Africa by the year 2030. Around 50 percent of the current population is living in the dark.The graphic evidence suggests that the following phase of electrification will be more challenging and more expensive and will require decentralized solutions, stronger utilities, and additional finance schemes.The most significant development, as noted in the scorecard, is perhaps financial inclusion. Only four out of ten adults in client countries had a financial account a decade ago. In the modern world, the number has reached 76%. The trend of the uphill slope of the chart is steep, which speaks to the fast proliferation of mobile banking, digital payments infrastructure, and inclusion policy-driven approaches.
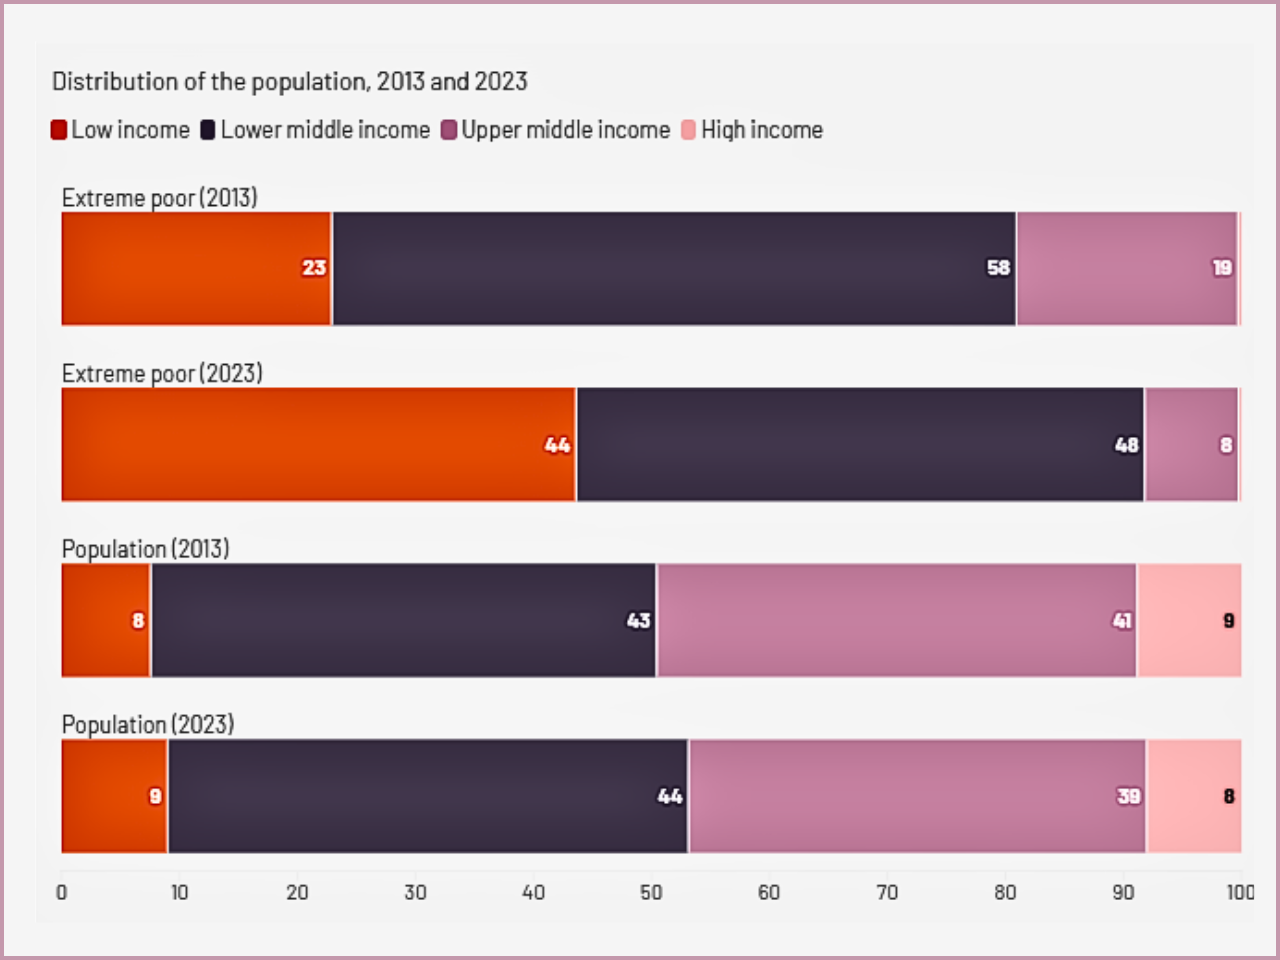
The financial inclusion of women in South Asia is one of the most dramatic, as the number of female account owners increased from 27% to 83%. Aesthetically, the gender gap that used to prevail in the chart has been significantly reduced, which signifies a change in structures and not marginal improvement.This revolution has serious economic consequences. The financial access increases savings behavior, promotes the development of micro-enterprises, increases resilience to shocks, and enhances the bargaining power of women in households. Nevertheless, the chart is an indicator of a business that is not over. Disparity between total and female ownership is still evident in a number of areas, especially in parts of Africa and weak states.In addition, there is not a one-to-one correlation between account ownership and active usage. The next policy frontier will be the further development of financial ecosystems, access to credit availability, and the need for digital inclusion to keep up with the account penetration. Forced Displacement: An Increasing and Lopsided Load. The least favorable aspect in the scorecard is the magnitude and the allocation of forced displacement. Over 123 million individuals worldwide are made to be displaced through conflict and violence or even persecution.The income-based breakdown in the visual analysis shows there is a dire lack of responsibility-sharing. Economies with low incomes harbor approximately 49 million displaced individuals, whereas there are 25 million and 29 million displaced individuals in lower-middle-income and upper-middle-income countries, respectively. As in the chart, it is evident that the poorest nations, the ones with the least fiscal power, are having the worst humanitarian and developmental load. The concentration at the country level also makes the picture more acute. The Sudan, the Syrian Arab Republic, and the Democratic Republic of Congo have become great epicenters of displacement in low-income settings. This clustering is indicative of conflict fragility, government breakups, and regional spillovers. In development economics, displacement data portend long-term risks. Large numbers of refugees place a burden on host countries in terms of resources such as health care, employment, housing, and social integration. Displacement will cause and sustain poverty among refugees and host populations without long-term international financing and integration policies.
The reason why the scorecard is relevant at this timeCollectively, the four visual stories, which include poverty, electricity, financial inclusion, and displacement, create a subtle global development image. The global society has recorded appreciable gains in the increased availability of basic services and monetary platforms. But the continued existence of severe poverty in certain areas and the increased intensity of forced movement demonstrate the structural weaknesses that can be concealed in the headline averages. There are a number of cross-cutting insights revealed by the data: To begin with, there is an even greater inequality in development. The progress in South Asia and some regions of East Asia is in sharp contrast to stagnation in weak and conflict-ridden areas.Second, the gains in service delivery (electricity, financial accounts) have been increasing at a faster pace than the convergence of income. This implies that while the basic access is getting better, productive change and creation of jobs have not matched the pace in most of the low-income environments.Third, weakness and war are taking center stage as the development constraints. As the number of displacements shows, the humanitarian crisis ceases to be marginal to global development; it is transforming it. Lastly, the very concept of data transparency is becoming a policy instrument. New poverty thresholds based on the 2021 PPP data are better at measuring poverty and capable of policymaking that is more responsive.Looking Ahead The scorecard will also become a progress report and a warning signal at the end of it. With a suitable combination of technology, policy, and finance, the global community has shown that rapid advances in electrification and financial inclusion can be made. Nevertheless, the recalcitrant geography of poverty and the intensification of forced movement indicate that the further stage of development will be more complicated.Three strategic changes are likely to be made in the future: further investment in weak and conflict-affected states, the scaling of inclusive digital and energy infrastructure in the lagging areas, and more robust international burden-sharing of displacement crises. There stand behind each piece of data lived realities: students attending school with new electric lights on, women opening their first bank accounts, and families finding it hard to escape poverty or displacement. The most important thing about the scorecard is to render these realities visible, measurable, and actionable. The trick now is to transform measurement into long-term fairness so that the development of the world attains the areas that continue to lag.