The liner shipping network of the world has been changing in an insidious yet significant way over the last twenty years. Though the amount of containerized trade has been growing and the number of nations that engage in scheduled services has been growing marginally, the tendency of countries that are directly linked by sea routes has been diluted. Maps and statistical distributions introduced in the analysis by Jan Hoffmann and Antonella Teodoro show a system that tends to be more centralized and organized around hub-and-spoke processes and that may be more difficult for less connected and smaller economies to deal with.
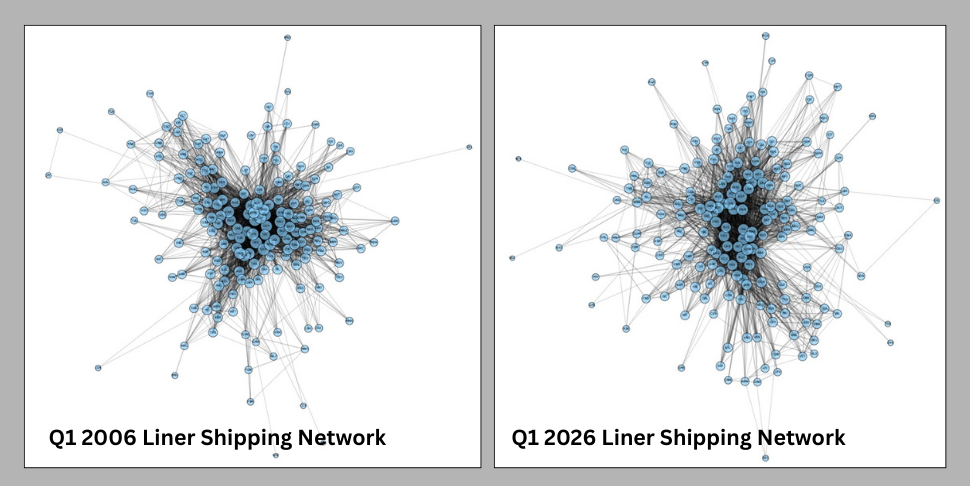
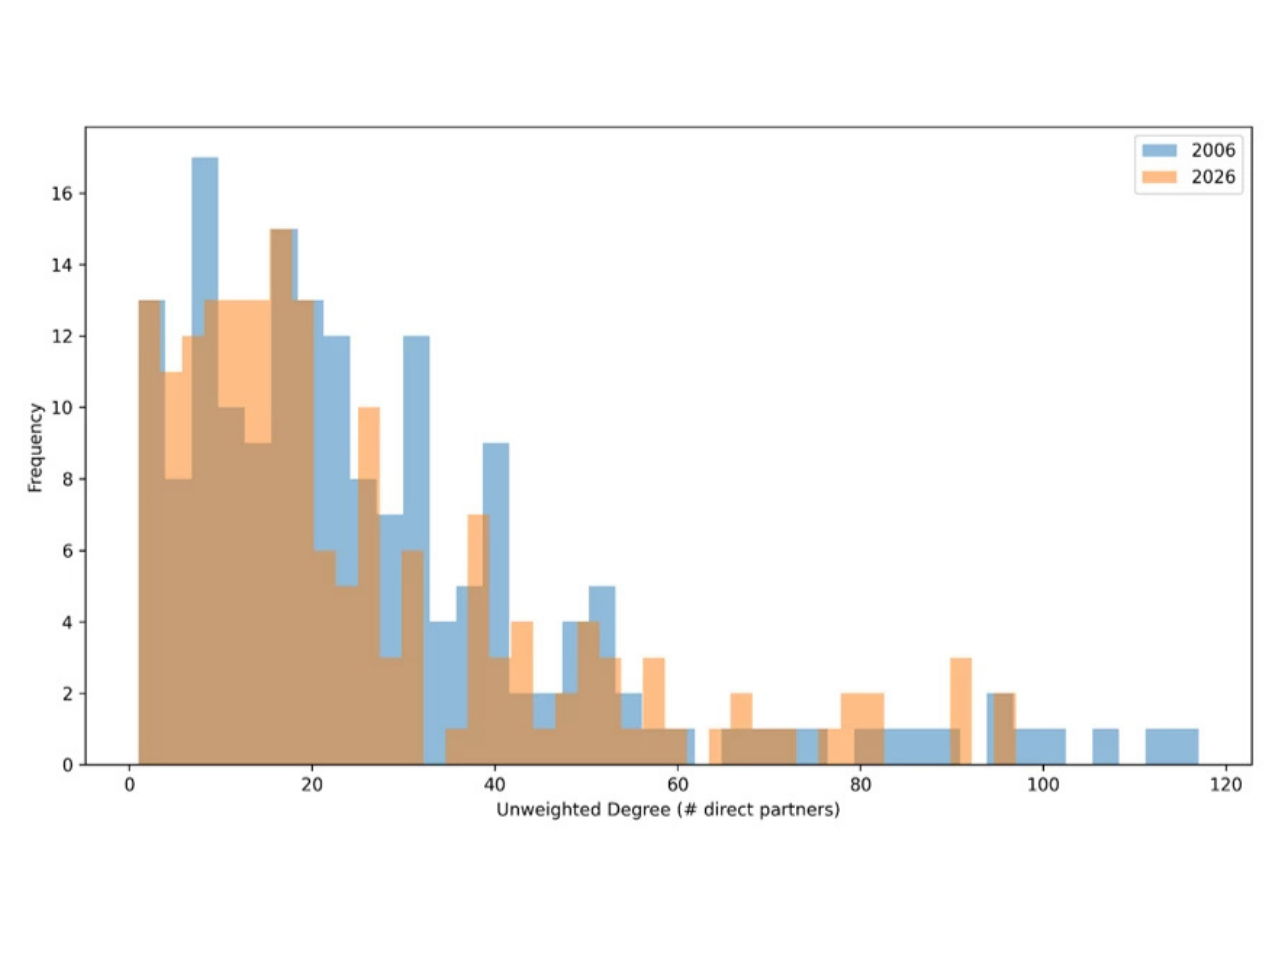
The initial two figures offer the network map of the liner shipping system in the world at the beginning of 2006 and that of 2026. The nodes are all countries, and the line indicates that there is at least one direct container shipping route between two countries. The connectivity (degree) is measured by node size, and the intensity of the relationship among the trading partners is measured by the clustering pattern. On the face of it, the two maps are dense and very interconnected, which implies further globalization of the maritime trade. Nevertheless, a more in-depth examination reveals that the 2026 network is a little bit more concentrated in large hubs. The central cluster seems to be more dominant and tighter in the middle, whereas the peripheral countries, small island states, and economies that are developing are poorly bonded at the periphery. The network had a wider distribution of the direct bilateral links in 2006. Although the overall number of countries involved in the direct country-to-country connections has also increased by 2026 (increasing to 178 countries), the number of direct country-to-country connections has decreased by 2,243 to 2,444. This means that involvement in the network has expanded, but the connectivity is more exclusive. Since the number of potential pairs of countries rose and the number of direct links reduced, the density of the network dropped to 14.2 percent compared to 16.2 percent. This practically translates to the fact that an increasing portion of the international trade traffic is now transited via intermediate ports and no longer goes directly between the origin country and the destination country. Logistics chains, when transshipment is used by more than four out of five country pairs, are more dependent on big ports and carrier alliances. This has the ability to enhance efficiency in routes with high traffic, but it also tends to heighten congestion vulnerability, disruptions, and market concentration. Reduced direct partners in countries.
At the international level, the median number of liner companies per bilateral is constant at four. Nevertheless, the mean decreases from 8.32 to 9.76 from 2006 to 2026.The combination suggests that there is a significant nuance: the "normal" shipping connection remains with similar competitive coverage, but the busiest routes have lost a part of carrier variety. That is, consolidation has minimized the choice where competition was most intense and has increased the overall dispersion. On average, the number of companies connected directly also decreases at the level of the country, as well as in a large part of the distribution. A median of five carriers per route had been observed in the country in 2006 (average of six point seven), and some very connected countries averaged about twenty-four. By 2026, the trend is expected to be similar, but with the averages being slightly lower.In most developing economies and the small island states, routes are still operated by a small number of operators. This continuing asymmetry brings out structural inequality in access to maritime. Facilitators of the hub-and-spoke change. There are a number of forces that underlie the explanation of the development of the global liner network. To start with, the industry consolidation has minimized the independent shipping lines. The formation of networks through mergers, acquisitions, and alliances has enabled carriers to rationalize networks and eradicate redundant direct services. Second, there is a drastic increase in vessel sizes. The economies of scale of ultra-large container ships can only be achieved when they are used in high-volume trunk routes among major hubs. This inherently promotes hub-and-spoke structures, with cargo in smaller markets being channeled into transshipment ports instead of direct service. Third, pressure on operational efficiency forces carriers to reduce the number of port calls. Every extra stop will add time, fuel, and complexity to the schedule. Due to this, lines are more favorable to a few volumes and higher volume calls in ports that are doing well.
Why do smaller economies suffer the most? The structural change is of the greatest concern to the countries that are at the lower end of the connectivity spectrum. Countries most likely to have one or two direct partners in both years are the least connected, and many of them are small island developing states. To these economies, trade-led development is a binding measure on maritime accessibility. Increasing dependence on transshipment may imply increased freight charges, increased and unpredictable transit times, decreased service rates, and increased sensitivity to hub congestion. Since foreign investment, export competitiveness, and supply chain involvement rely greatly on logistics performance, a deterioration in direct connectivity may create development disparities unless addressed. Factors that predetermine the position of the country in the network. As discussed in the analysis, three fundamental factors define the direct service to a country by the shipping lines. Domestic demand base and hinterland demand. Carriers are more attracted to ports that have high import and export volumes. Direct calls cannot be maintained commercially without adequate cargo throughput. The fact that countries are situated close to large east-west or north-south lines of trade is what makes countries close to the route have lower deviation costs for their carriers. Peripheral regions or remote island states are disadvantaged in their structure. Port efficiency is highly important in terms of time. Increased turnaround time lowers the costs of running a vessel and makes a port more competitive in the network design choices. Another force is vertical integration.
In cases where shipping lines invest in terminal operations, they will bring their associated services to those ports, which is likely to strengthen the dominance of the hub and reduce competition.With these trends, the improvement of connectivity is not that much concerned with the increase in the number of shipping lines across the world, but rather the national competitiveness in the current network structure. Port efficiency and logistics system bottlenecks are also diagnosed with the assistance of the Container Port Performance Index (CPPI), Logistics Performance Index (LPI), and Global Supply Chain Stress Index (GSCSI) tools. In the case of many developing countries, specified investments in port facilities, digitalization, efficiency in terms of customs, and connection of the hinterland can become the best option to either attract or keep direct services.Comprehensively, the data between 2006 and 2026 indicates that there is an international liner shipping network in the world that is still highly internationalized but progressively centralized. The transition to hub-and-spoke operation is a logical commercial reaction by the shipping lines to the scale economies and financial strains. Nonetheless, it also presents strategic issues of resilience, competition, and fair access to worldwide commerce. The main dilemma for policymakers, particularly in smaller and developing economies, is as follows: in a world where the direct maritime connections are less pronounced, the enhancement of port performance, reinforcement of cargo bases, and effective integration into the network of hubs will become fundamental to the preservation of competitiveness in world trade.