Crop Emissions Exposed: How Rice, Corn, and Palm Oil Are Heating Up the Planet
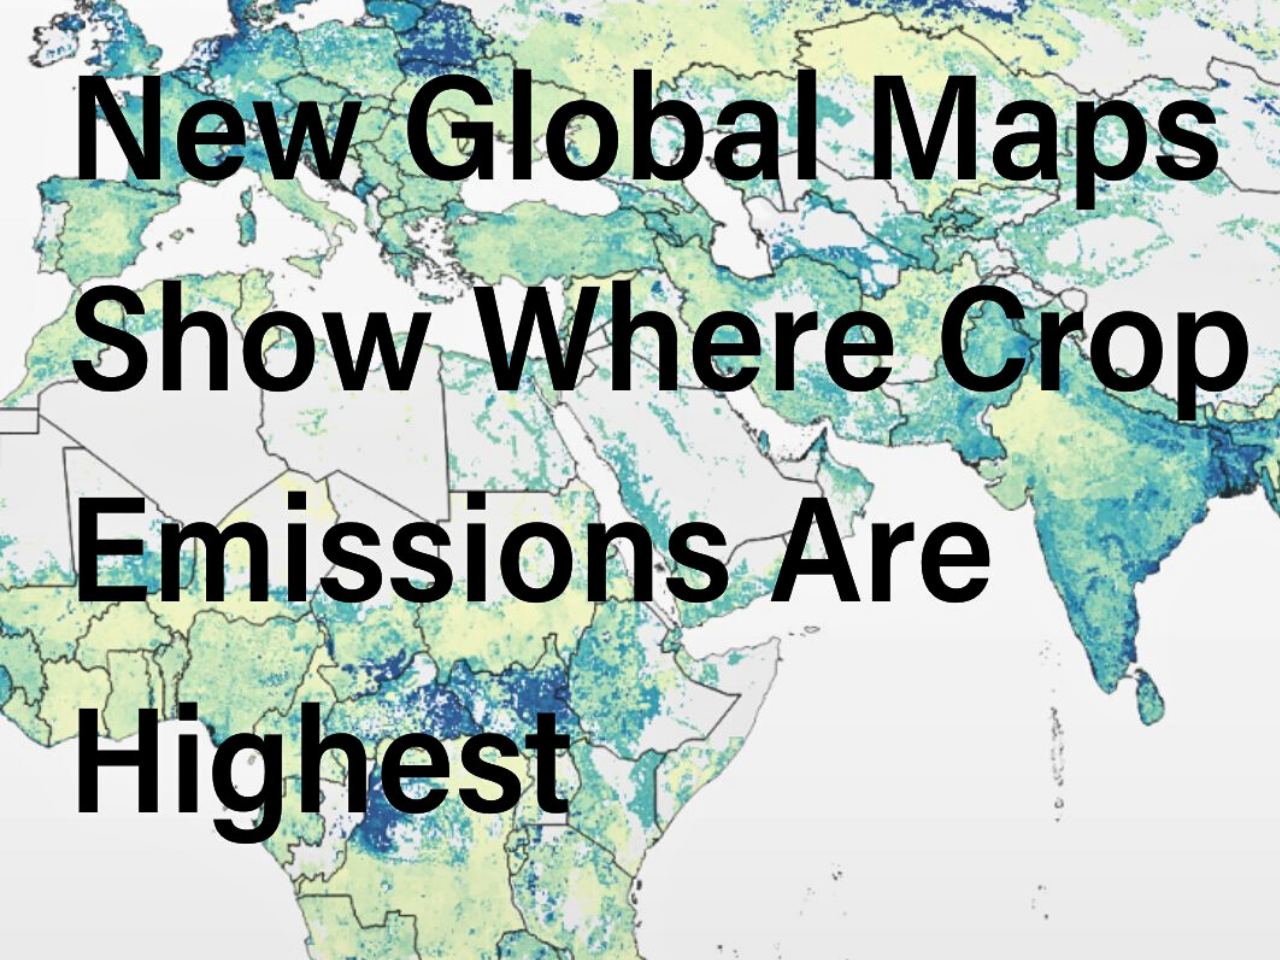
Climate discussions have a tendency to under-report greenhouse gas emissions (GHG) from crops (i.e., the land used to produce food, feed for livestock, fiber, and biofuels). According to new global mapping research conducted by both Cornell and Land & Carbon Lab, croplands alone contributed to an estimated 5% of total anthropogenic GHG emissions in 2020. While that percentage might seem small, it is higher than global shipping emissions and comparable to emissions produced via tropical primary forest loss. Most of the crop-related emissions come from a small number of crops. Rice, corn/maize, wheat, and oil palm account for 67% of total world crop-related emissions out of hundreds of crops that are grown around the world due to both their large land area production and present-day farming practices that use synthetic fertilizers on an extremely high level, along with heavy manure use, residue burning from crop production, and drainage of peatlands for agriculture.
The 2020 global agricultural industry emitted 2.5 billion tons of carbon dioxide equivalent, which represents 19% of total net emissions from the global land sector. Three primary emission sources accounted for the majority (93%) of total crop-related emissions. They were draining peatlands (35%), flooding rice paddies (35%), and applying synthetic fertilizers (23%). The remaining 7% of emissions originated from other sources such as burning crop residues and using manure. The drainage of peatlands for agricultural purposes has harmful effects not only in terms of carbon dioxide emissions, but also through the generation of other greenhouse gases (GHGs). When waterlogged peat soils are drained, they become aerobic, and microbial activity converts previously stored organic carbons into carbon dioxide and other GHGs. When rice paddies are flooded, they create anaerobic conditions that promote GHG-producing microbes to convert organic carbon into methane, which has more than 25 times the potential for climate warming as carbon dioxide over 100 years.
The use of synthetic fertilizers by farmers introduces another GHG into the atmosphere through the conversion of excess nitrogen from fertilizer that is not utilized by crops into nitrous oxide, which has nearly 270 times the climate warming potential of carbon dioxide. The emissions associated with oil palm crops are very complicated. Approximately 2% of world farmland is used to plant oil palm, yet it produces a lot of emissions due mainly to the fact that it is often planted on peatland, which has a lot of carbon stored in it, especially in Southeast Asia. Simultaneously, oil palm is one of the most land-efficient crops for producing calories. The bulk of the Earth’s crop emissions come from six countries: China, Indonesia, India, the USA, Thailand, and Brazil, which collectively account for 61% of total crop emissions. The high rate of emissions produced by China, India, Indonesia, and Thailand is mainly due to rice production, which is a staple food for billions of people. On the other hand, Brazil and the United States have higher levels of emissions associated with fertilizer-heavy farming practices. Indonesia is also unique in that a large part of its emissions is due to the expansion of oil palm plantations onto peatland. Agriculture patterns do not solely rely on either climate or soil. They also reflect historical trade routes, colonial legacies, subsidy programs from government entities, dietary practices, and investments in infrastructure that have ultimately determined how crops are distributed across the globe today. In Southeast Asia, the palm oil industry is booming due to favorable growing conditions and many years of government endorsement and export demand, which led to increased production. Wheat and corn were matured for many years. Seed breeding and how they have been supported by add-on services have had a major impact on how these products are elevated and marketed at the regional level. These practices have continued to impact carbon emissions from wheat and corn production. It could be reduced with the use of products that are more environmentally friendly.
New emission maps look at both the carbon emissions produced when compared to the land area of production (i.e., areal intensity) as well as how many calories are produced per gram of carbon emissions (i.e., caloric intensity), therefore highlighting an interesting paradox whereby the highest emissions are produced in the most productive area of the world; thus, those regions (e.g., Asia) have high carbon emissions per hectare, explaining why Asia will produce high volumes of food. In contrast, sub-Saharan African regions have relatively low emissions per hectare because they don’t have as much access to modern agricultural inputs, therefore producing fewer total calories from the same land; their emissions improvements per calorie produced will not be as drastic. Between 2000 and 2020, global crop production rose by 50%, while cropland emissions increased by 17%. Nitrous oxide emissions from fertilizers and manure grew by 35%, particularly in southern China, India, Indonesia, and southern Brazil. Due to regional variations in methane emissions, a global decrease in rice emissions was counterbalanced by an increase in South and Southeast Asia. Emissions from drained peatlands rose slightly in Southeast Asia, though uncertainties remain in data estimates. Feeding a projected global population of nearly 10 billion by 2050 without sharply increasing emissions presents a critical challenge. Due to staple crops being the building blocks of food security, cultural identity, and livelihoods, replacing these crops is not an option that either makes sense or is desirable. Changes in agricultural practices will be the viable means of advancing.
For instance, with rice, mitigation of methane emissions can occur through alternating the permitting of wet and dry periods instead of flooding. Crop residue management (composting or using straw as animal feed) can also contribute to the reduction of greenhouse gas emissions by not burning or incinerating waste products resulting from rice productivity. In terms of fertilizer-related emissions, emissions can be reduced using the “4R” (the four “rights”) method: the right fertilizer source, the right rate, the right time, and the right place. Research indicates that if the “4R” principles are followed, nitrous oxide emissions can be reduced by 20% to 50%. In peatland agriculture, partial rewetting of drained soils to reduce the rate of carbon release will allow for the continued cultivation of the land. Therefore, for agriculture to be considered “climate smart,” it should seek to balance the desire for food production with the need to protect biodiversity, store carbon, and meet industrial demand for limited land. Thus, the objective is not to compromise food security in an effort to take action against climate change but instead to have agricultural systems that are sustainable within the limits of the planet and contribute to the maintenance of the function of natural ecosystems, restoration of degraded land, improved productivity of existing farmland, and a decreased quantity of emissions per food-produced unit of measure.
Monthly Edition